Introduction
Use the content tables on the Insights page to compare specific titles, drill into per-title performance, and identify cross-promotional opportunities. The redesigned Insights page consolidates the legacy Content Catalog and Content Explorer tables into the Top Content tile, so the same audience-size, attention-index, and view-share columns are now available in one sortable leaderboard.
Top Content table
The Top Content tile is the per-title leaderboard on the Insights page. Each row represents one piece of content; the visible columns are the same metrics that the legacy Content Catalog table exposed.
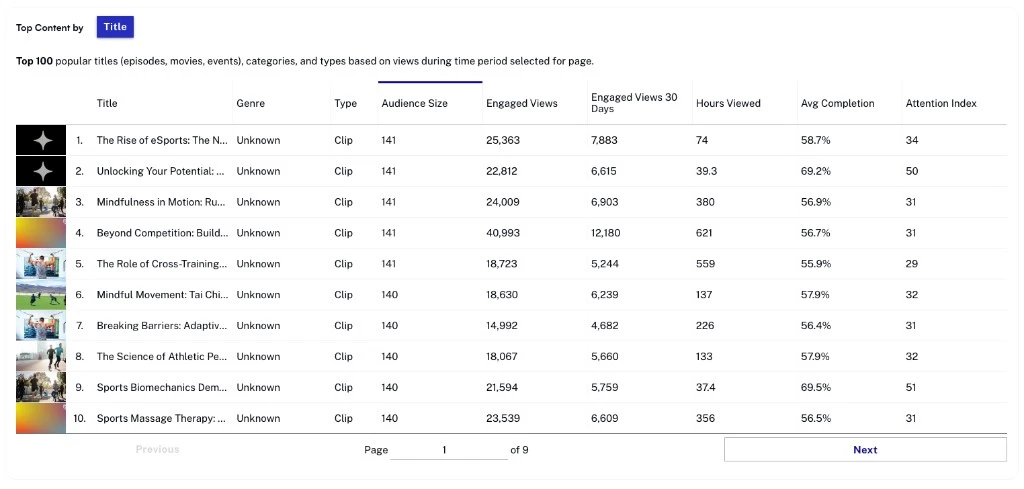
- Title — Title of the content viewed.
- Genre — Genre associated with the content.
- Type — Type of content (for example, Clip).
- Audience Size — Number of unique viewers in the selected period.
- Engaged Views — Total number of engaged views.
- Engaged Views 30 Days — Number of engaged views in the last 30 days.
- Hours Viewed — Total hours of content viewed.
- Avg Completion — Average percentage of content watched by viewers.
- Attention Index — On a scale of -100 to 100, compares the number of dissatisfied viewers with viewers who watched to at least 75% completion.
Actions
The Top Content table supports the same per-row and table-level actions as the legacy Content Catalog. Use the column headers to sort, the search field to filter by title, and the table's overflow menu to download the current view as a CSV file. The page-level time-range and granularity controls scope the rows shown.