Navigation
To open the Analytics tab for a video, follow these steps:
- Log in to your Video Cloud account.
- In the primary navigation, click Media.
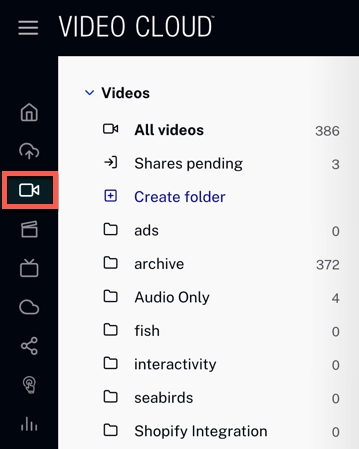
Media in the primary navigation - Click the title of the video you want to analyze.
- In the right tab rail, click Analytics.

Analytics tab in the right rail
All time
The All time row summarizes a set of metrics that lets you view the status of the asset at a glance.
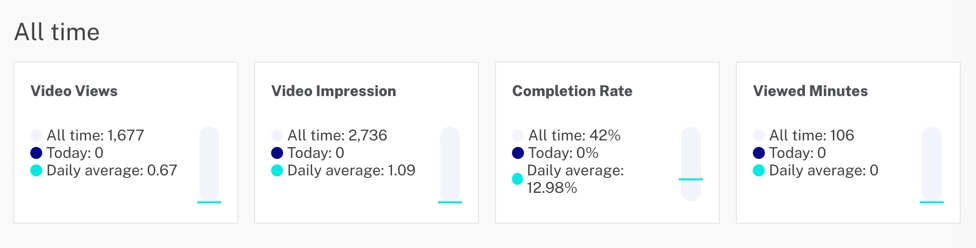
The following metrics are shown. Each card displays the All time total at the top, the Today count below, and a bar that compares Today against the daily average. Scroll the row horizontally to reveal the rest of the cards.
- Video Views — the number of times the video started playing.
- Video Impressions — the number of times the video was loaded into a player and ready for interaction.
- Completion Rate — the average percentage of the video that was watched (sum of percentage completed / Video Views).
- Viewed Minutes — the total number of minutes the video was viewed.
- Engagement Score — the average percent watched per Video View.
- Play Rate — the percentage of impressions that resulted in a play (Video Views / Video Impressions).
- Unique Viewers — the number of distinct viewers.
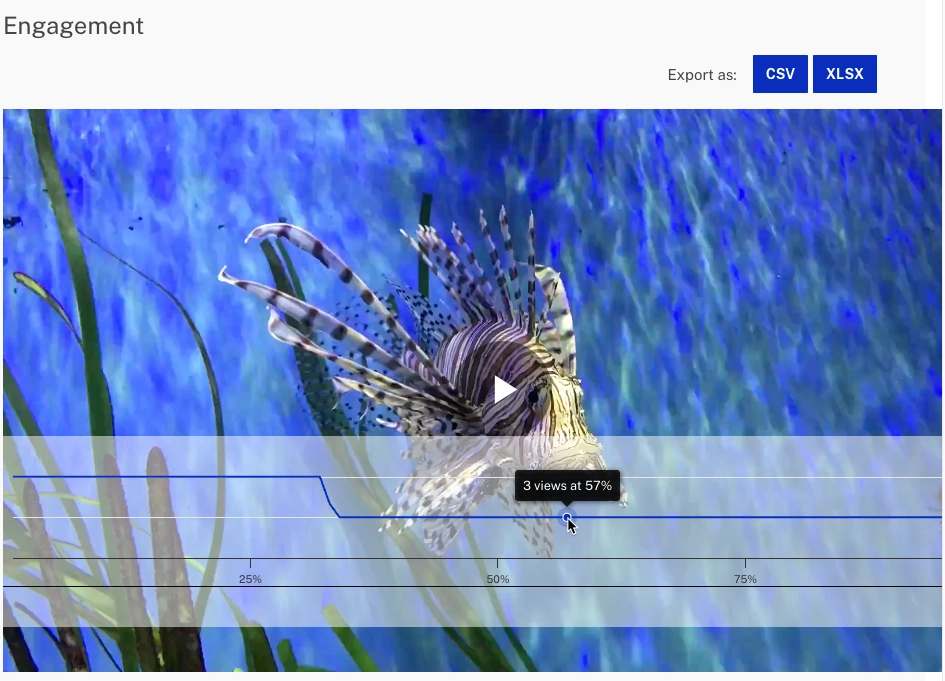
Video Views
The Video Views tile embeds the video player so you can play the asset directly from the Analytics tab and confirm what viewers see.
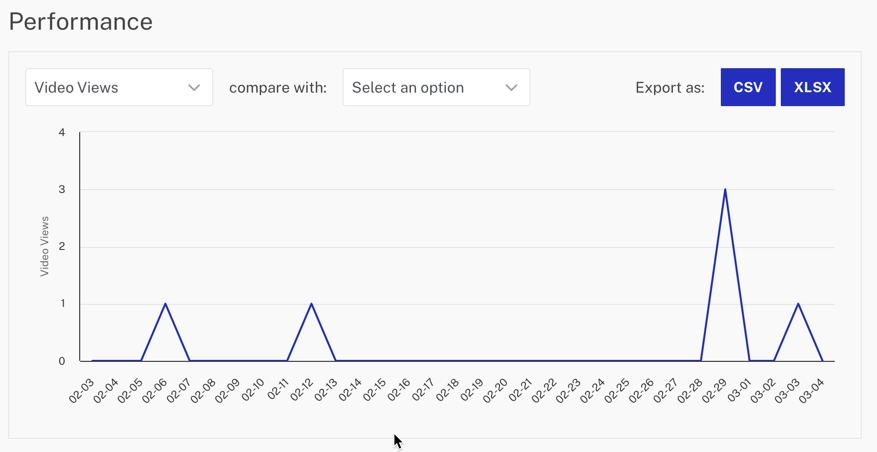
Performance
The Performance chart plots a daily series for the selected metric over the last 30 days and can overlay a comparison series.
Actions
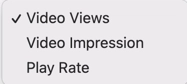
- Click the metric dropdown
 to change the main series. Available metrics: Video Views, Video Impressions, Play Rate, Viewed Minutes, Engagement Score, and Unique Viewers.
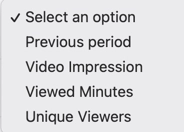
- Click the compared to dropdown
 to overlay a second series. Options: None, Previous period, Video Views, Video Impressions, Play Rate, Viewed Minutes, Engagement Score, or Unique Viewers.
- Click the export icon
 to download the data as a CSV or XLSX file.
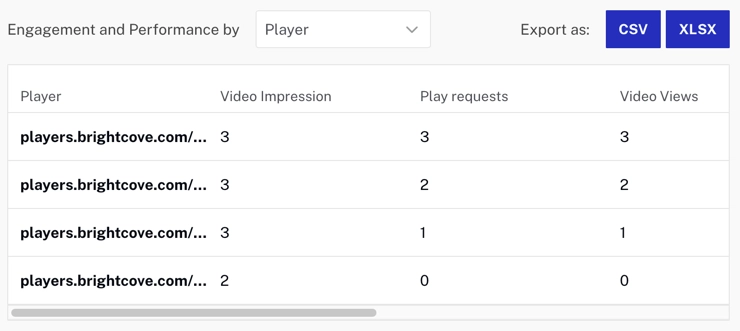
Video Metrics
The Video Metrics table breaks the same metrics down by a dimension you choose.
Actions
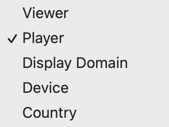
- Click the grouping dropdown
 to group the rows by Player, Country, Device, Destination Domain, Destination Path, Referrer Domain, Referrer Path, Source Type, Social Platform, Viewer, Caption Track Language, or Audio Track Language.
- Click the export icon to download the data as a CSV or XLSX file.
Caption and Audio Track Analytics
When viewers enable captions or switch audio tracks during playback, the Caption and Audio Track Analytics section displays two tables that summarize that activity for the video.
Captions Enabled by Language
This table shows which caption languages viewers enabled and how many times captions were enabled for each language. Each row displays the caption language code and the Captions Enabled count.
Audio Track Selected by Language
This table shows which audio track languages viewers selected and how many times each audio track was selected. Each row displays the audio track language code and the Audio Track Selected count.
Actions
- Use the Language grouping dropdown to view the data grouped by language.
- Click the export icon to download the data as a CSV or XLSX file.