Introduction
Popular content metrics let you quickly see what is attracting your audience's attention. The redesigned Insights page surfaces this view through the Popular Content tile and the related Content Engagement key-metrics tile, so you can identify top titles and the cross-content trends that drive views.
Popular Content tile
The Popular Content tile is the consolidated leaderboard of titles that are driving views in the selected period. It replaces the legacy "Popular content by" chart and uses the same page-level time-range and granularity controls as the rest of the Insights page.
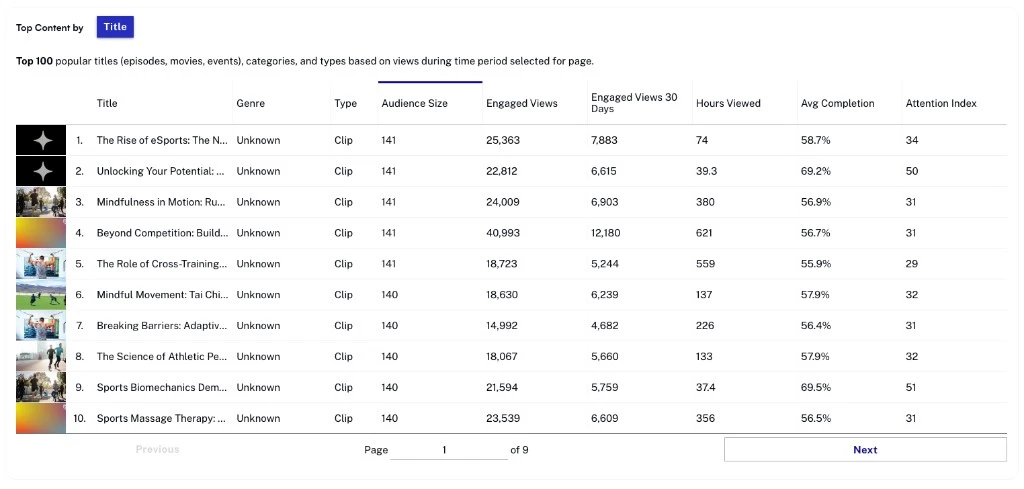
- Title — Title of the content.
- Hours viewed — Total hours viewed in the selected period.
- Video views — Number of times the video started playing.
- Audience size — Number of unique viewers.
Actions
Sort by any column header to rank titles. Use the table's overflow menu to download the current view as a CSV file. The page-level date range and granularity drive which titles appear and over what window.
Milestones
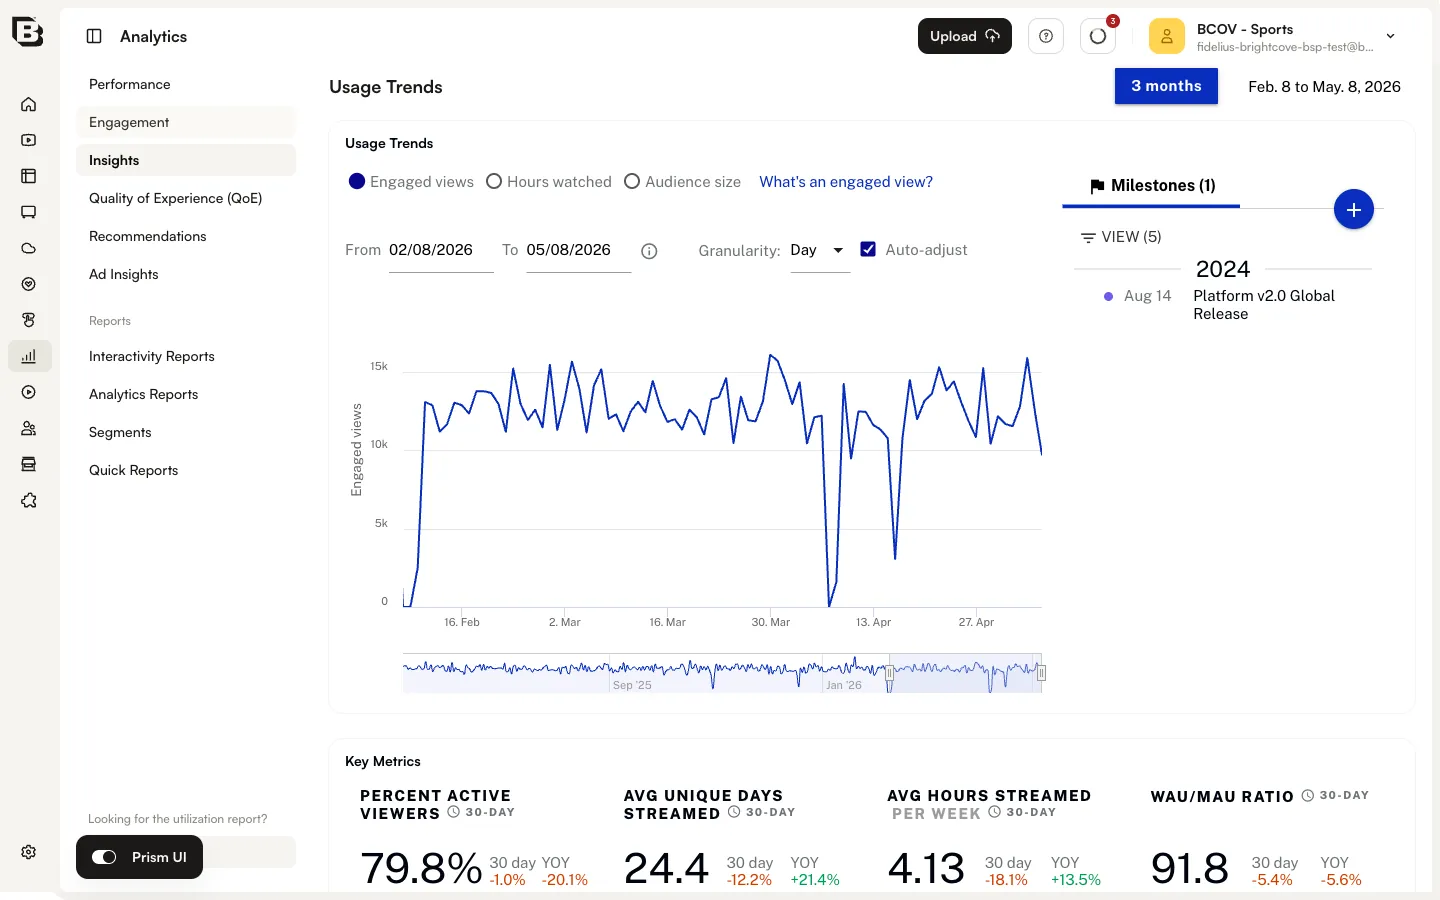
Milestones let you mark significant decisions or events on the Insights timeline so you can correlate them with shifts in your content metrics. Milestones persist across the Insights page tiles, so a marker added on one chart appears on every chart that shares the same time axis.
Adding a milestone
- Click the + milestone control above the chart.
- Enter a name and a description for the milestone.
- Pick the date the milestone applies to.
- Click Save.
Editing or deleting a milestone
Click a milestone marker on the chart to open its details, then use the Edit or Delete action. Use the VIEW control above the chart to choose which milestone categories are visible.
Content Engagement key metrics
The Content Engagement tile gives you a unified view of cross-content performance. It sits alongside the Popular Content tile on the Insights page and uses the same page-level time-range controls.
- Percent library viewed — Percentage of videos in your library that were watched.
- Percent viewers watching new content — Percentage of viewers (subscribed or not) who are watching new content.
- Avg attention index — Average attention index across viewers and content in the selected period.
- Percent active bingers — Percentage of users who watched three or more episodes of the same series in a 24-hour window.
Actions
Use the tile's overflow menu to download the current key-metrics snapshot as a CSV file.
Viewing by day part
The Viewing by Day Part metric grouped views by the local time the viewer consumed content (morning, afternoon, evening, late night). If a view stretched across multiple day parts, that view was counted in each. Day-level patterns can now be inspected on the Sessions Over Time chart by switching the page-level granularity to Day.