Getting Started with the Analytics Module
The Analytics Platform is a state-of-the-art, close to real-time analytics platform built from the ground up by Brightcove using the latest innovations in Big Data technology and architected for massive scale. The analytics platform offers fast, close to real-time access to analytics data and includes a powerful open API to allow developers to create custom analytics solutions and reports in addition to those included within Studio.
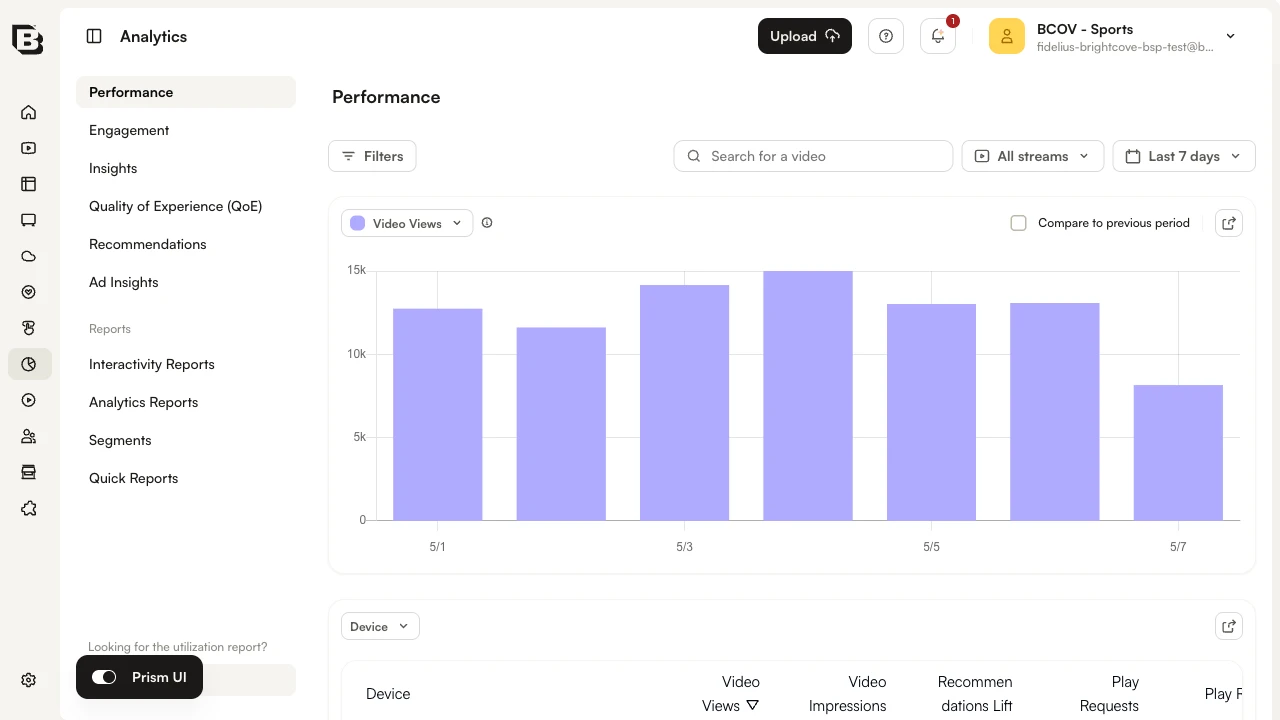
Regardless of your specific goals for online video, understanding your audience is a key to developing a successful video strategy. The better you understand your viewers, the easier it is to create content that will engage them in formats they can easily consume. The Analytics module groups its data into the following sections, each available from the left navigation:
- Performance - Video views, plays, traffic sources, devices, operating systems and browsers
- Engagement - How viewers engage with your videos and what percentage of each video they watch
- Insights - Usage trends, engaged views, hours watched, audience size and key metrics
- Quality of Experience (QoE) - Quality score, video start time, rebuffer time, upscale time and error rate
- Recommendations - Lift driven by Related Content, Trending Now and Most Recent recommendations
- Ad Insights - Ad consumption, ad metrics and viewer engagement with ads
Using these sections, you can review up-to-date data about how many viewers you have, how much content they are watching, when they stop watching, and the traffic sources for your content.
This topic includes the following sections that describe how to use the Analytics module:
Note that all data displayed in the Analytics module is also available through the Analytics API. For more information, see the Analytics API documentation.
Launching the Analytics module
To launch the Analytics module:
- Login to Studio.
- In the left navigation, click the Analytics icon.
Selecting a time span
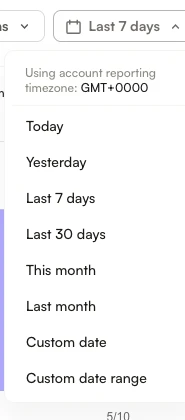
Use the date selector at the top right of the page to specify the time period for the data. Choose a fixed range (Today, Yesterday, Last 7 days, Last 30 days, This month, Last month) or pick Custom date or Custom date range. When a single day is selected, the graphs display by hour.
Reporting time zone
Data in the Analytics module is shown using the account's reporting time zone. The time zone is displayed at the top of the date selector dropdown.
The reporting time zone is used to calculate day boundaries for reporting data. Changing the reporting time zone setting only affects data going forward, and changes are not applied retroactively. If you change this setting, you may see a flat spot or a spike in your data when looking at day boundaries where the change was applied. Updates to this setting may not take effect immediately, and analytics data may continue to refer to the old setting until the system processes the changes.
The reporting time zone can be configured as part of the account settings. For information on changing the reporting time zone, see Managing Account Settings.
Searching for a video
Use the Search for a video field at the top of the page to filter the current report by a specific video.
The following video properties will be searched:
- Name
- Short description
- Long description
- Tags
- Video ID
- Reference ID
- All custom fields
The current report (Performance, Engagement, etc.) is filtered to the videos that match. The search stays applied as you switch between left-navigation sections, so you can review the same video across Performance, Engagement and other sections without re-entering the search term.
For a complete list of options that are available when searching for videos in the Analytics module, see How to Search for Videos in the Analytics Module.