Introduction
Engagement Insights reveal the audience's interaction with your content library. These include detailed usage trends of video consumption, average days streamed, and activity over time. The Insights data allows you identify ideal videos per session and the number of series watched to maximize conversions and lifetime value.
The Insights metrics enhances results with improved customer acquisition, service engagement, and reduced churn.
Usage Trends
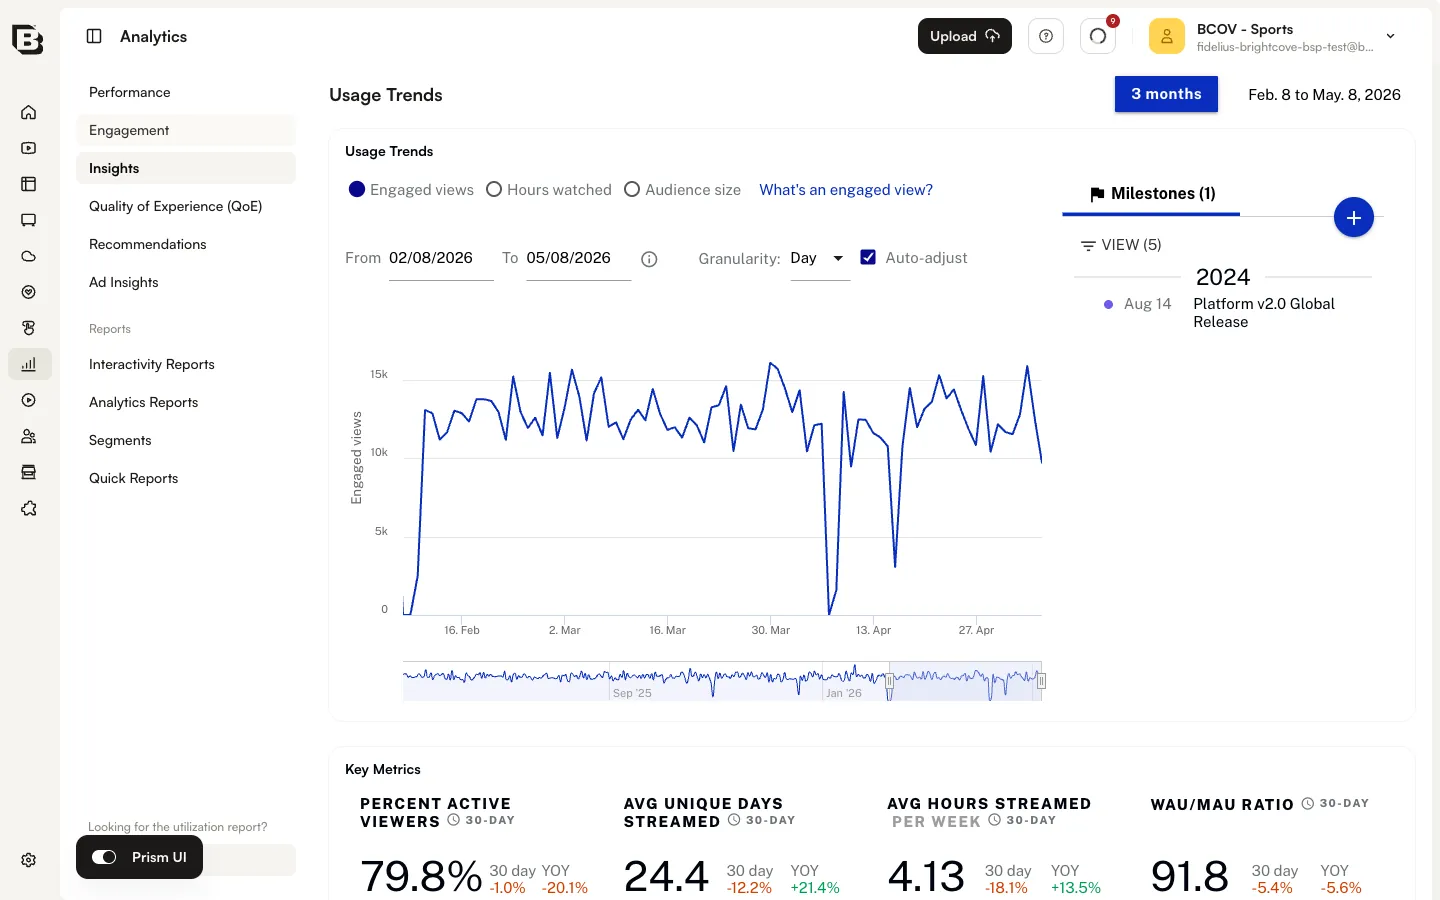
The Usage Trends chart at the top of the Insights page shows engaged views, hours watched, and audience size over the selected time range.
Metric options
Use the radio buttons above the chart to switch the displayed metric:
- Engaged views — Views that meet Brightcove's engaged-view definition. Click What's an engaged view? next to the radios to see the current definition.
- Hours watched — Total hours of content watched across the audience.
- Audience size — Number of distinct viewers active in the period.
Time range and granularity
- Use the date-range control at the top of the page (for example, 3 months) to change the period covered by every chart on the Insights page.
- Use the From and To date pickers to set a custom range.
- Use the Granularity dropdown to bucket the data by Day, Week, or Month.
- Select Auto-adjust to let Brightcove pick a granularity that fits the chosen range.
Milestones
The Milestones panel beside the Usage Trends chart lets you mark significant business events (releases, launches, campaigns) so you can correlate them with audience behavior. Milestones persist across the Insights page.
Adding a milestone
Click the + button on the Milestones panel to add a new milestone. Enter a date and a label, then save.
Viewing and filtering milestones
Use the VIEW control at the top of the Milestones panel to choose which milestones are visible. Each visible milestone is plotted as a marker on the Usage Trends, Sessions Over Time, and Content Trends charts.
Editing or deleting a milestone
Click an individual milestone in the list to edit or delete it.